Insights
Insights is released in Unleash 6.0 and is available for Enterprise and Pro customers. For Pro customers only the Total users and Total flags charts are available.
Insights is a feature designed to help you better understand and gain insights into what is happening in your Unleash instance. You can view insights across all projects or by selecting single or multiple projects using the filter.
In total, there are 6 different charts available that show information over time:
- Total users (Pro, Enterprise)
- Total flags (Pro, Enterprise)
- Average health (Enterprise)
- Median time to production (Enterprise)
- Flag evaluation metrics (Enterprise)
- Updates per environment type (Enterprise)
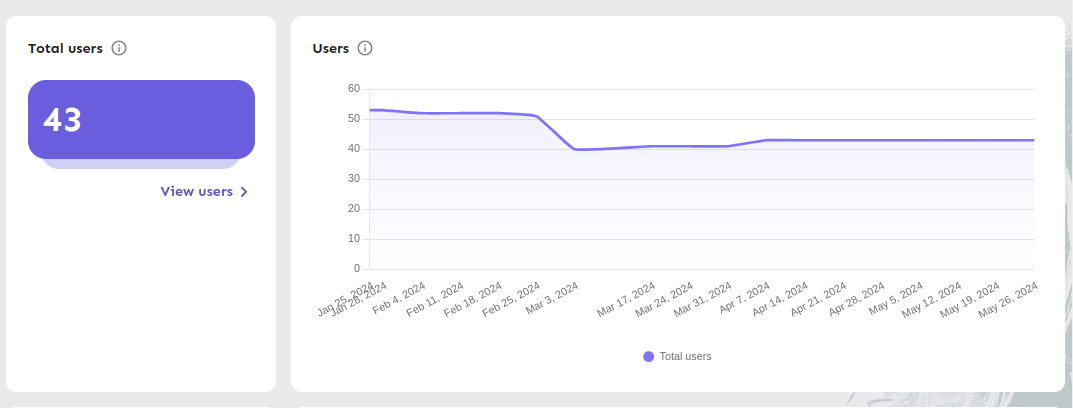
Total users
The Total users chart provides information about the total number of current users in your Unleash instance. This chart helps you understand how the user base is growing or changing over time. Additionally, it shows the number of users in selected projects and how the user distribution varies among them.
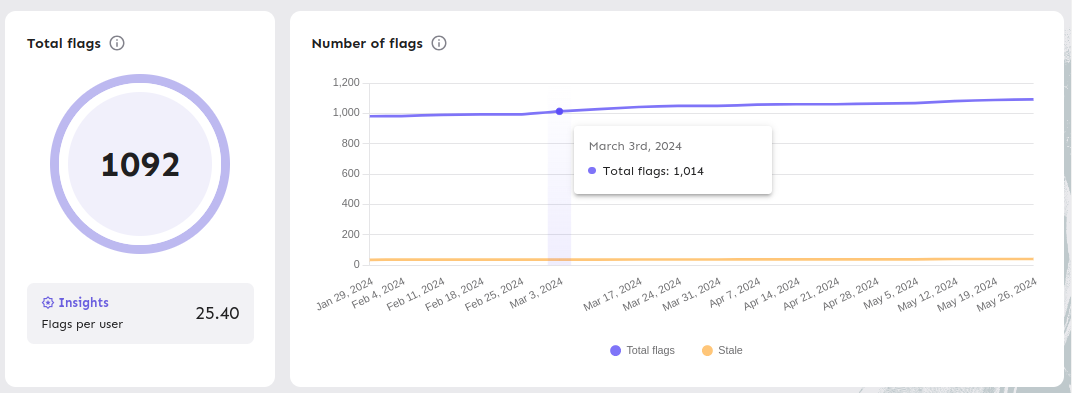
Total flags
The Total flags chart displays the total number of active (not archived) feature flags across all projects. It provides insights into how the number of flags has changed over time, helping you track the growth and usage of feature flags. You can also view the data for specific projects.
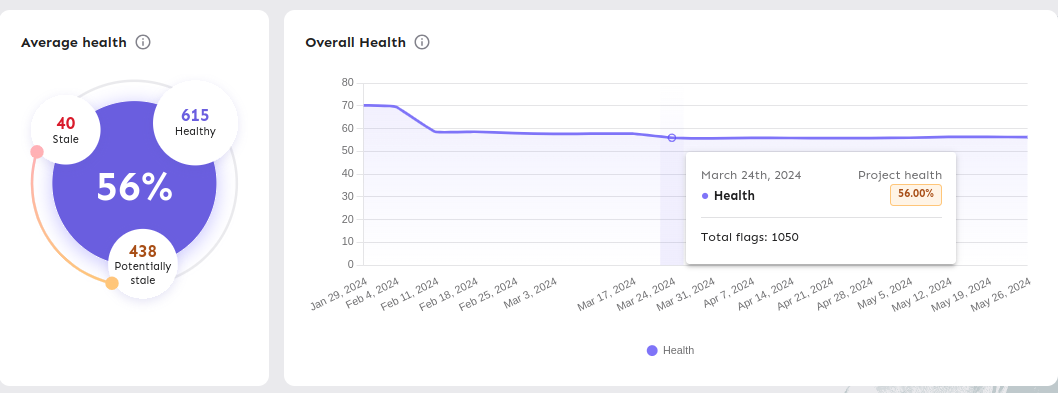
Average health
The average health chart represents the percentage of flags in the selected projects that are not stale or potentially stale. This chart helps you monitor the overall health of your feature flags, ensuring that they are actively maintained and relevant. The chart also shows how the overall health changes over time, allowing you to identify potential issues early and take corrective actions.
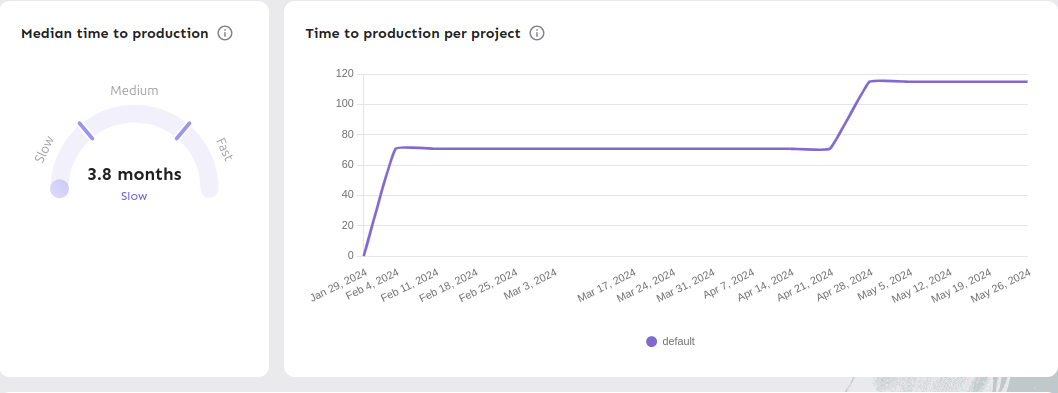
Median time to production
The median time to production chart measures the average time from when a feature flag is created until it is enabled in a "production" type environment. This metric is calculated only for feature flags of the type "release" and is the median across the selected projects. Understanding this metric helps in assessing the efficiency of your development and deployment processes. It also highlights areas where you can improve to reduce time to market for new features.
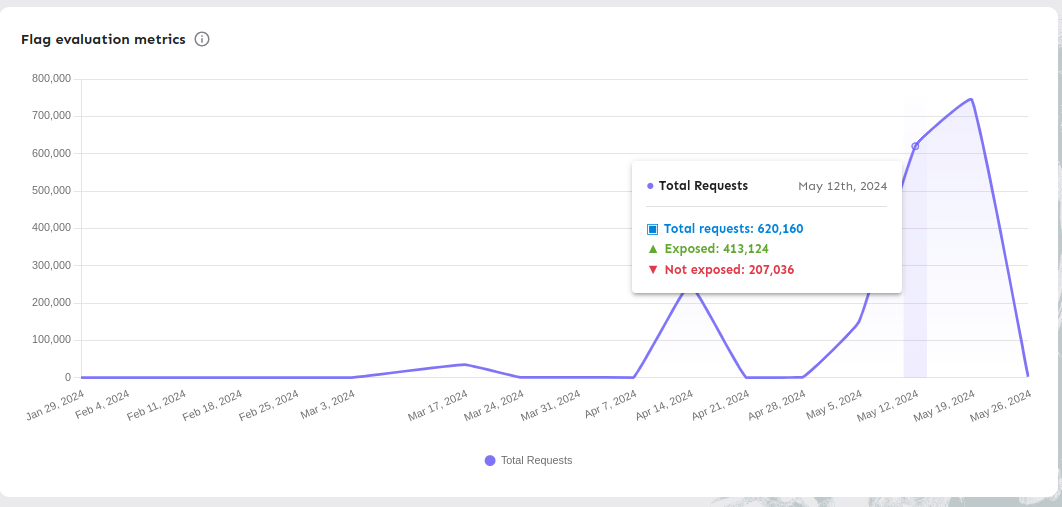
Flag evaluation metrics
The flag evaluation metrics chart provides a summary of all flag evaluations reported by SDKs across all projects. This chart helps you understand how often feature flags are being evaluated and used within your applications. It can indicate the performance impact and the effectiveness of your feature flag implementations. By analyzing these metrics per project, you can gain deeper insights into the usage patterns and optimize accordingly.
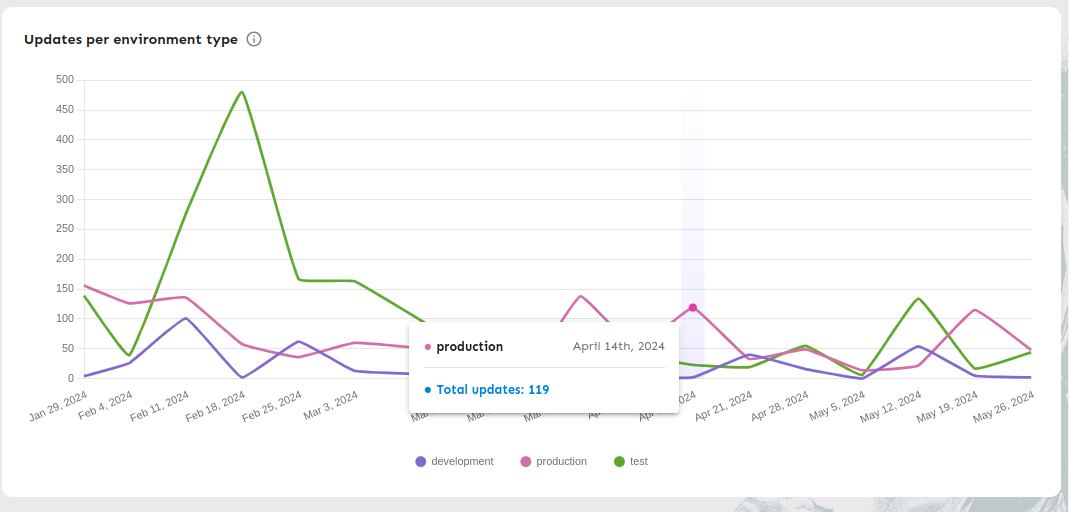
Updates per environment type
The updates per environment type chart summarizes all feature configuration updates per environment type. This chart is crucial for understanding how configuration changes propagate across different environments, such as development, testing, and production. It helps in tracking the frequency and impact of updates, ensuring that changes are consistently and safely deployed. Monitoring updates per environment type can also help identify potential bottlenecks or issues in the deployment pipeline.